


As a trader, being able to identify reversal patterns can help you determine the best times to buy and sell to maximize your profits. The key is knowing which patterns to look for and how to interpret them. In this article, we’ll explore some of the most reliable bullish and bearish reversal candlestick patterns so you know what to watch for and can start trading with confidence. Spotting these patterns is a skill that takes practice, but will serve you well as you navigate the ups and downs of the market.
Understanding Candlestick Patterns for Reversal Trading
Reading Candlestick Patterns
Candlestick patterns are visual representations of the battle between bulls (buyers) and bears (sellers) in the market. To understand them, you first need to know how to read a candlestick. Each candle shows you four important details: the open, high, low and close price of that time period.
The color and size of the candle body indicates who won. A green (or white) candle means the close was higher than the open, so the bulls were victorious. A red (or black) candle means the bears won and the close was lower. The wicks or shadows protruding from the top and bottom of the candle show the high and low.
Longer wicks indicate greater volatility. The relationship between the open and close and the length of the wicks reveal the strength of either buyers or sellers.
Reversal patterns are what you want to spot for trading. Bullish reversals signal an uptrend, while bearish reversals indicate a downtrend. The hammer, morning star, and bullish engulfing pattern are popular bullish reversals. The shooting star, evening star, and bearish engulfing pattern are well-known bearish reversals.
However, never trade based solely on a pattern. Look at other technical indicators to confirm the trend reversal and check the current market sentiment. The power of crowds and overall momentum will determine if that pattern results in a lasting trend change. Sometimes a pattern fails, so always use a stop loss in case the reversal doesn’t follow through.
With practice, you’ll get better at identifying patterns and determining the strength of the trend reversal signal. Candlestick patterns, when combined with other tools, can be a useful way to spot opportunities in the market. Keep at it, and soon you’ll be reading the charts like a pro!
Top 5 Bullish Reversal Candlestick Patterns
If you’re looking to spot reversal trends in the markets, candlestick patterns are a trader’s best friend. Some of the most powerful bullish reversal patterns are –
- Hammer
- Bullish engulfing
- Piercing pattern
- Tweezer bottom
- Morning star
Hammer
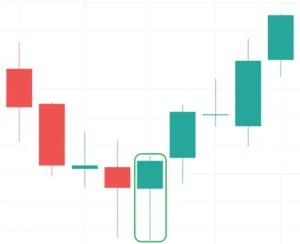
The hammer shows that buyers overwhelmed sellers, pushing the price up after a decline. It has little to no upper shadow, closes at the top quarter of the range, and a lower shadow two to three times the length of the body. This means sellers initially pushed the price down, but buyers came in strong at the bottom and closed it higher.
Bullish Engulfing
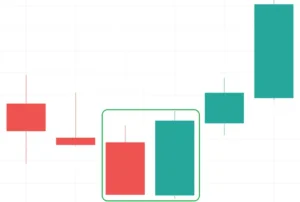
Next is the bullish engulfing pattern, which is a two-candle pattern that completely “engulfs” the previous candle. The first candle closes bearish but the second bullish candle’s body fully covers it, showing buyers have taken control from the sellers.
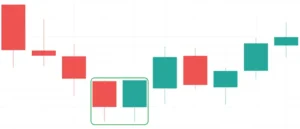
Piercing

A piercing pattern also has two candles with the first closing bearish, but the second candle closes beyond the halfway point of the first candle, though not engulfing it. While not as strong as the engulfing pattern, it still demonstrates buyers are now in the driver’s seat.
Tweezer Bottom
The tweezer bottom, made up of two or more candles with matching bottoms, shows the price was rejected from going lower, then closed higher. This pattern reveals the market has found a potential bottom.
Morning Star
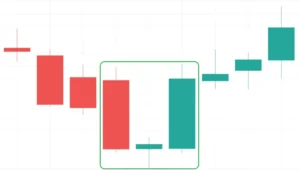
Finally, the morning star has a long bearish candle, followed by a small real body (either bullish or bearish), then a bullish candle that opens below the first candle’s close and closes above the first candle’s midpoint. This shows sellers were first in control but have now lost power to the buyers.
In summary, these bullish reversal patterns signify the market sentiment may be changing from bearish to bullish. Keep an eye out for them to potentially spot good buying opportunities. Of course, always consider the overall context of the market before making any trading decisions.
Top 5 Bearish Reversal Candlestick Patterns
When it comes to bearish reversal candlestick patterns, here are the top 5 you need to know:
- Shooting star
- Bearish engulfing
- Dark cloud cover
- Evening star
- Tweezer tops
Shooting Star
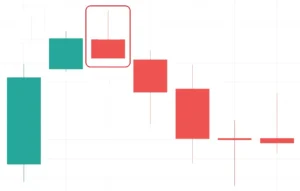
A shooting star forms after prices have been rising. It signifies the sellers are putting up a fight. It has:
- Little or no lower shadow
- Closes in the bottom quarter of the trading range
- Indicates the uptrend may be losing steam
If a shooting star appears after a large upward move, it could mean the bulls have overextended themselves. Watch for follow through selling pressure.
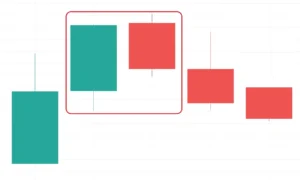
Bearish Engulfing Pattern

This pattern shows the sellers have overwhelmed the buyers. It contains:
- A small bullish candle followed by a larger bearish candle
- The body of the second candle completely engulfs the first candle
- Suggests the bullish trend may be ending as bears take control
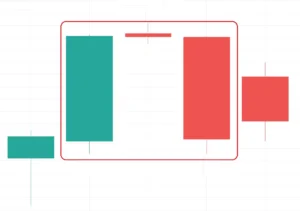
Dark Cloud Cover
Similar to the bearish engulfing pattern but the second candle doesn’t fully engulf the first. It signifies:
- The uptrend is weakening as the bears counterattack
- Formed by a long white candle followed by a black candle that opens higher but closes below the midpoint of the white candle
The dark cloud is a warning the bulls may be losing power. Look for increased selling volume to confirm the reversal.
Evening Star
An evening star is a three-candle bearish reversal pattern that forms at the top of an uptrend. It contains:
- A large white candle, followed by a small candle that gaps up, then a large black candle that gaps down and closes well into the first candle’s body.
- Indicates the sellers have overwhelmed the buyers and the trend may be changing.
The evening star is one of the most reliable top reversal signals. Watch for increased volume on the third black candle for confirmation.
Tweezer Tops

This bearish reversal pattern contains:
- Two candles with matching highs at a price level the stock has had trouble breaking through in the past.
- The pattern shows the buyers have failed twice at the same level, suggesting the uptrend is weakening.
- Look for a sell-off after the pattern completes, especially if volume increases.
The tweezer top pattern is a sign the trend may reverse to the downside. Consider taking profits or tightening stops to protect any gains.
How to Trade Bullish and Bearish Reversals
Once you spot a bullish or bearish reversal candlestick pattern, the next step is knowing how to trade it. The key is confirming the reversal before entering a trade. Here are a few tips:
Look for volume
An increase in volume during the reversal candlestick pattern indicates that there are many traders actively participating in the price swing. This adds strength to the reversal signal. If the volume is low or average, be cautious. The reversal may not follow through.
Check the trend
Make sure the reversal pattern is going against the prevailing trend. For example, a bullish engulfing pattern during an uptrend is less reliable. It’s best if the pattern appears at the end of a downtrend for a bullish reversal or at the end of an uptrend for a bearish reversal.
Look for additional confirmation
Don’t rely on a single candlestick pattern. Look for other technical indicators that confirm the reversal, like moving averages crossing over or a trendline break. You can also wait for the next 1-2 candles to close in the reversal direction before entering a trade. This confirms that the momentum is shifting.
Set a stop loss
Always have a stop loss in place in case the reversal does not follow through. Place the stop loss below the low of the bullish reversal pattern or above the high of the bearish reversal pattern. This way, if the momentum does not shift in your favor, you limit your losses.
Target previous swing highs/lows
For profit targets, look for the previous swing highs and lows. Bullish reversals often target the last swing high, while bearish reversals target the last swing low. You can also use other technical tools like Fibonacci extensions to identify potential target levels.
By following these tips, you’ll have a higher chance of success when trading bullish and bearish reversal candlestick patterns. Remember, never rely on a single pattern and always confirm the reversal before entering a trade. With practice, trading reversals will become second nature!
Conclusion
So now you have the knowledge about the best candlestick patterns that can signal a reversal in the market trend. These patterns are not a guarantee, but they increase the probability of a reversal. The key is to use other indicators to confirm the reversal before entering a trade.
Practice identifying these patterns in real time and on historical charts to get better at spotting them. Once you get the hang of it, you’ll be able to spot reversal patterns forming before the reversal has even happened and be able to get in right at the beginning of the new trend. Keep learning and practicing – candlestick patterns, when combined with other skills, can be a valuable tool for any trader.
